Bitcoin Chart Setup Points to Possible $76K Move, With Confirmation Still Missing

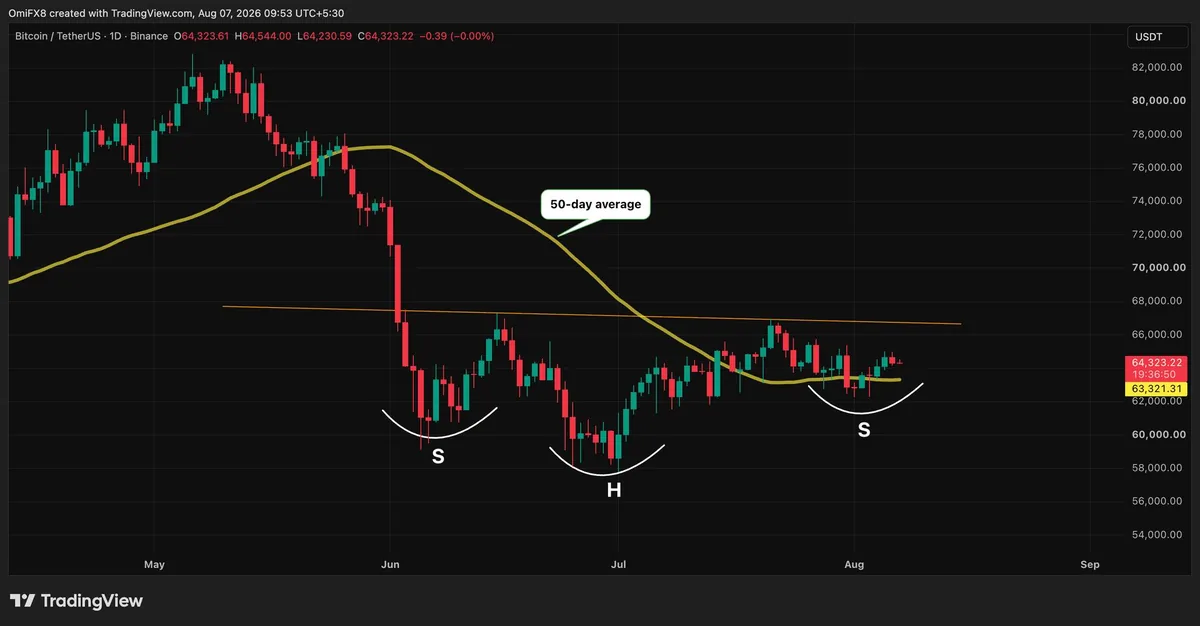
Bitcoin’s daily chart is showing a possible inverse head-and-shoulders pattern that technical analysts associate with bullish reversals. The setup would only be confirmed if BTC breaks decisively above the roughly $66,800 neckline, while weakness below the 50-day average could undermine the case.

Bitcoin Chart Setup Points to Possible $76K Move, With Confirmation Still Missing

What happened?

Bitcoin’s daily chart is showing a possible inverse head-and-shoulders pattern that technical analysts associate with bullish reversals. The setup would only be confirmed if BTC breaks decisively above the roughly $66,800 neckline, while weakness below the 50-day average could undermine the case.

Why it matters

The development matters because traders often watch this pattern as a potential reversal signal after selling pressure begins to fade. In this case, the structure described by CoinDesk includes a left shoulder near $60,000 in early June, a deeper head around $57,700 in late June or early July, and a right shoulder formed after a bounce from roughly $62,500.

Bitcoin’s recent trading has looked quiet, but CoinDesk reported that the daily chart may be forming a bullish inverse head-and-shoulders pattern. If confirmed, the setup could imply a move toward about $76,000, based on the pattern’s measured depth.

The development matters because traders often watch this pattern as a potential reversal signal after selling pressure begins to fade. In this case, the structure described by CoinDesk includes a left shoulder near $60,000 in early June, a deeper head around $57,700 in late June or early July, and a right shoulder formed after a bounce from roughly $62,500.

The key level is the neckline, placed at about $66,800 at the time of the report. A decisive break above that area would be the signal chart-focused traders would look for before treating the pattern as active.

There are important limits to the bullish reading. Technical analysis is subjective, and the pattern has not yet been confirmed. CoinDesk also noted uncertainty around the Clarity Act as a possible headwind, with fading odds of passage this year reducing a regulatory catalyst some traders had expected.

On the downside, the report highlighted bitcoin’s 50-day simple moving average, near $63,321, as a level to watch. A clear move below it would suggest the setup is weakening rather than preparing for a breakout.

Source: CoinDesk

Keep exploring

Related stories

XRP Leads Major Crypto Losses as Clarity Act Vote Moves to September

XRP Leads Major Crypto Losses as Clarity Act Vote Moves to September

Bitcoin held near $64,300 while XRP posted the steepest weekly decline among major tokens after the U.S. Senate left for its August break without voting on the Clarity Act. The delay keeps a key crypto market-structure bill unresolved until at least September.

Read
Proposed CLARITY Ethics Deal Could Require Trump Crypto Divestment

Proposed CLARITY Ethics Deal Could Require Trump Crypto Divestment

A bipartisan ethics proposal tied to the CLARITY Act would reportedly require Donald Trump to sell crypto-related business interests. Bloomberg reported that the structure could also allow him to defer capital gains taxes on those sales.

Read
Japan FSA Urges Crypto Exchanges to Slow Withdrawals in Scam Crackdown

Japan FSA Urges Crypto Exchanges to Slow Withdrawals in Scam Crackdown

Japan’s Financial Services Agency has asked crypto exchanges to introduce withdrawal delays and other account safeguards to help curb scam-related misuse. The proposed measures include address registration, customer-specific transfer limits and stronger authentication.

Read