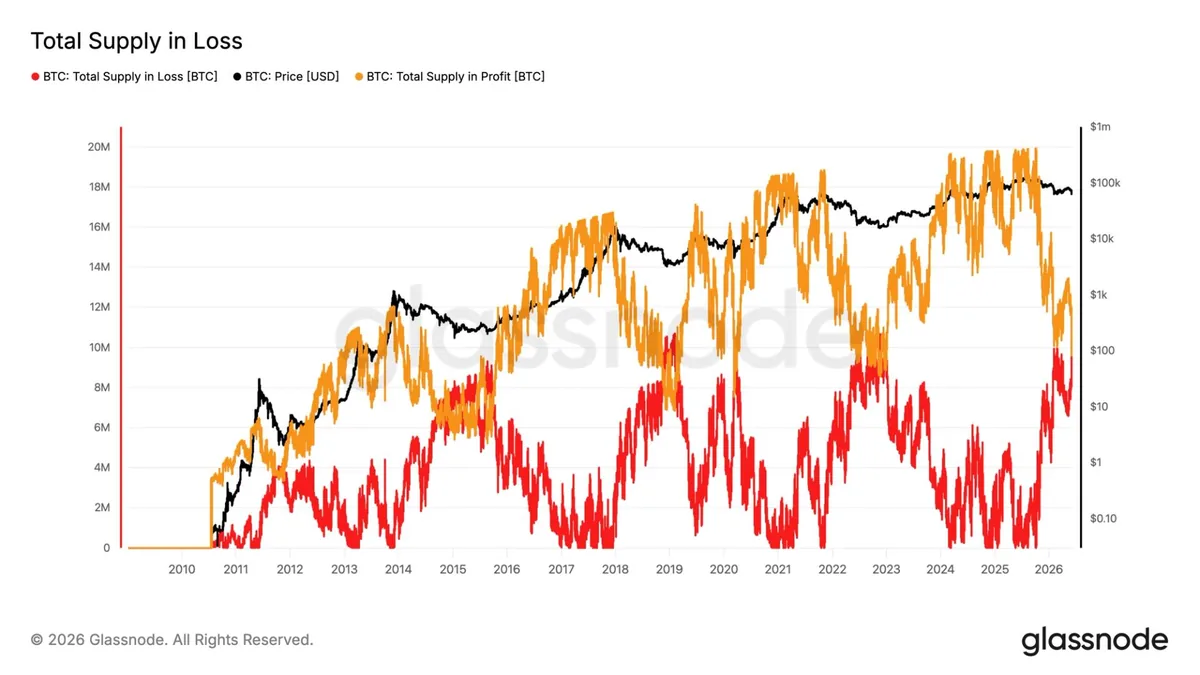
A closely watched bitcoin on-chain metric has flashed a bear-market signal: the amount of BTC held at an unrealized loss has risen above the amount held in profit. According to Glassnode data cited by CoinDesk, supply in loss peaked at about 10.5 million BTC as bitcoin fell to as low as $61,300 on Thursday, while supply in profit dropped to around 9.8 million BTC.
The development matters because this crossover has historically appeared only in deep bear-market conditions and has often coincided with major market bottoms. It does not indicate how long weakness may last, but it gives traders and market observers a way to compare the current drawdown with prior bitcoin cycles.
CoinDesk noted that more than half of bitcoin’s roughly 20 million circulating coins are now sitting at an unrealized loss. This is the first time in the current market cycle that loss-making supply has overtaken profitable supply.
Past episodes varied widely in duration. In 2015, supply in loss and supply in profit stayed near balance for almost a year before recovery. In 2019 and 2022, similar conditions lasted about six months, while the March 2020 Covid-driven capitulation lasted roughly one month.
Bitcoin also touched its 200-week moving average near $61,300, a long-term trend level that CoinDesk said has acted as major bear-market support in previous cycles. If BTC falls below $60,000, the next major support zone cited in the report is around $54,000, corresponding to bitcoin’s realized price, or the average acquisition cost based on when coins last moved on-chain.