Bitcoin Nears Bear-Cross Signal That Has Historically Marked Market Bottoms

Bitcoin’s 50-week moving average is close to falling below its 100-week average, a bearish-looking signal that has historically appeared near major market bottoms. CoinDesk noted that the pattern is lagging and not a guarantee, with macro conditions, ETF flows and Strategy’s activity still important for Bitcoin’s next move.

Bitcoin Nears Bear-Cross Signal That Has Historically Marked Market Bottoms

What happened?

Bitcoin’s 50-week moving average is close to falling below its 100-week average, a bearish-looking signal that has historically appeared near major market bottoms. CoinDesk noted that the pattern is lagging and not a guarantee, with macro conditions, ETF flows and Strategy’s activity still important for Bitcoin’s next move.

Why it matters

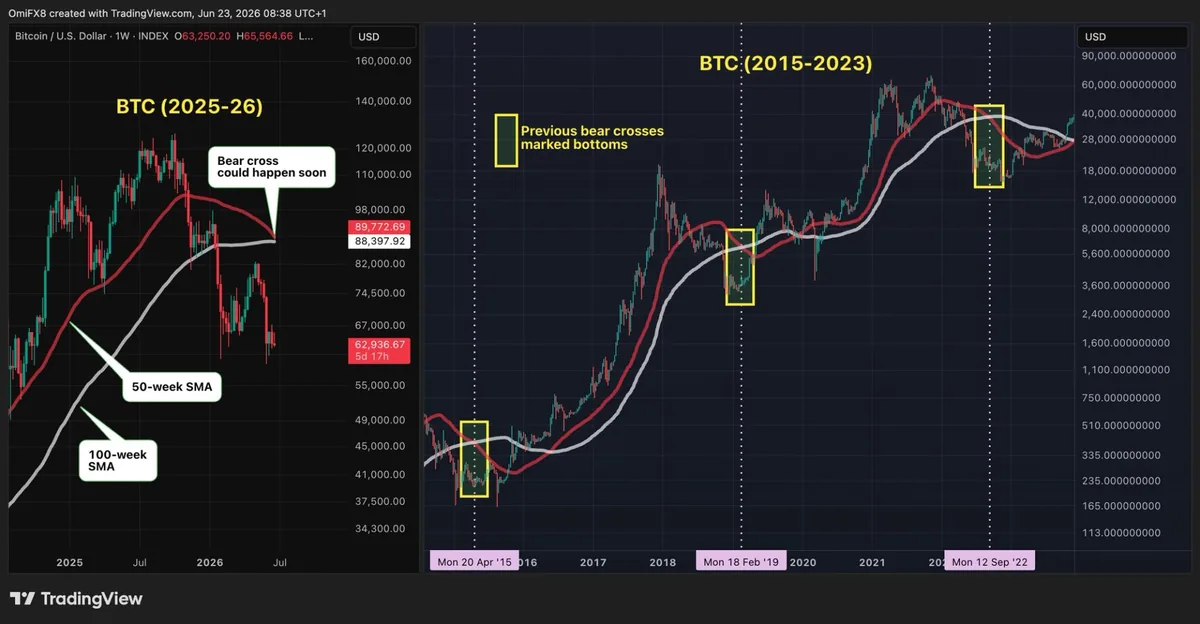
Bitcoin is approaching a technical signal that may suggest its downside is becoming limited, according to CoinDesk. The market’s 50-week simple moving average is close to dropping below the 100-week average, forming what traders call a bear cross, which could happen as soon as next week if current trajectories continue.

Bitcoin is approaching a technical signal that may suggest its downside is becoming limited, according to CoinDesk. The market’s 50-week simple moving average is close to dropping below the 100-week average, forming what traders call a bear cross, which could happen as soon as next week if current trajectories continue.

The development matters because this type of signal can look negative at first glance, but CoinDesk described it as a historically contrarian indicator for Bitcoin. In the three prior cases cited, similar bear crosses marked bear-market bottoms and preceded renewed multi-year rallies.

The reason the signal can be read differently is that long-term moving averages are backward-looking. They reflect price action that has already happened, including Bitcoin’s drop from $126,000 in October to nearly $60,000, rather than offering a clean forecast of what comes next.

CoinDesk also cautioned that three past examples are not enough to treat the pattern as certain. Past market behavior does not guarantee future results, and broader factors can still override technical setups.

At the time of CoinDesk’s report, Bitcoin was trading near $62,400, while the 50-week average stood at $89,771 and the 100-week average at $88,397. The article pointed to bond yields, ETF flows and the latest actions from Strategy (MSTR) as factors that remain important for Bitcoin’s next move.

Source: CoinDesk

Keep exploring

Related stories

Senate Delays CLARITY Act Vote Until September as Democrats Hold Out

Senate Delays CLARITY Act Vote Until September as Democrats Hold Out

The Senate will not vote on the CLARITY Act before lawmakers leave for recess, with Majority Leader John Thune saying it will be queued up when they return in September. The delay leaves Democrats and Republicans with a limited window to secure the 60 votes needed for passage.

Read
Bitcoin whales buy $1.2 billion in BTC as spot ETFs draw $750 million

Bitcoin whales buy $1.2 billion in BTC as spot ETFs draw $750 million

Large bitcoin holders added about $1.2 billion worth of BTC while spot bitcoin ETFs recorded roughly $750 million in inflows. The activity points to continued institutional and large-investor demand in the market.

Read
Bitcoin Wallet Dormant Since 2011 Moves $3.2 Million to FalconX-Linked Address

Bitcoin Wallet Dormant Since 2011 Moves $3.2 Million to FalconX-Linked Address

A bitcoin wallet inactive since 2011 moved about $3.2 million in BTC to an address linked to FalconX. The transfer highlights continued movement from long-dormant early-era wallets.

Read