CoinDeskAug 02, 06:50 AM
Strategy Keeps STRC Dividend at 12%
Strategy said it is holding the dividend on its STRC preferred stock at 12%. The decision keeps the payout unchanged for investors in the company’s yield-focused security.
ReadA CoinDesk analysis says bitcoin and the S&P 500 look less robust when their prices are adjusted for growth in the U.S. M2 money supply. The comparison suggests nominal market highs may be masking a thinner valuation picture for risk assets.

A CoinDesk analysis says bitcoin and the S&P 500 look less robust when their prices are adjusted for growth in the U.S. M2 money supply. The comparison suggests nominal market highs may be masking a thinner valuation picture for risk assets.
Bitcoin and the S&P 500 appear less impressive when viewed against the expansion of the U.S. M2 money supply, according to a CoinDesk market analysis published June 17. The report argues that dollar-denominated price charts may understate how much asset valuations have been shaped by growth in the supply of liquid money.
Bitcoin and the S&P 500 appear less impressive when viewed against the expansion of the U.S. M2 money supply, according to a CoinDesk market analysis published June 17. The report argues that dollar-denominated price charts may understate how much asset valuations have been shaped by growth in the supply of liquid money.
The distinction matters because investors often judge market strength by nominal prices. Bitcoin has fallen to about $66,000 from a $126,000 peak in October, while the S&P 500 remains near record levels. But adjusting both assets for M2, which includes cash, checking and savings deposits, money market funds and certificates of deposit, produces a more cautious reading.
For bitcoin, the BTC-to-M2 ratio has weakened after climbing sharply from 2023 through 2025. CoinDesk noted that the ratio appears to have formed a head-and-shoulders pattern, a formation technical analysts often interpret as bearish. If that pattern holds, the analysis suggests bitcoin’s ability to outpace growth in the dollar supply may be fading, at least for now.
The same lens changes the story for equities. In nominal terms, the S&P 500 is far above its dot-com-era level, hovering near 7,511 compared with roughly 1,500 around its 2000 peak. Adjusted for M2 growth, however, CoinDesk says the index has only recently returned to that earlier high.
That does not mean today’s equity market is identical to the dot-com bubble. The report notes that corporate earnings are generally viewed as stronger and more durable than in 1999-2000. Still, the money-supply-adjusted comparison suggests that a quarter-century of monetary expansion has been required for the index to regain its prior valuation level on this measure.
CoinDesk framed bitcoin as a potential signal for broader risk appetite because it has sometimes moved ahead of wider macro shifts. Whether the weaker money-adjusted readings lead to broader market pressure remains uncertain, but the analysis adds context for readers looking beyond headline price charts.
Keep exploring

Strategy said it is holding the dividend on its STRC preferred stock at 12%. The decision keeps the payout unchanged for investors in the company’s yield-focused security.
Read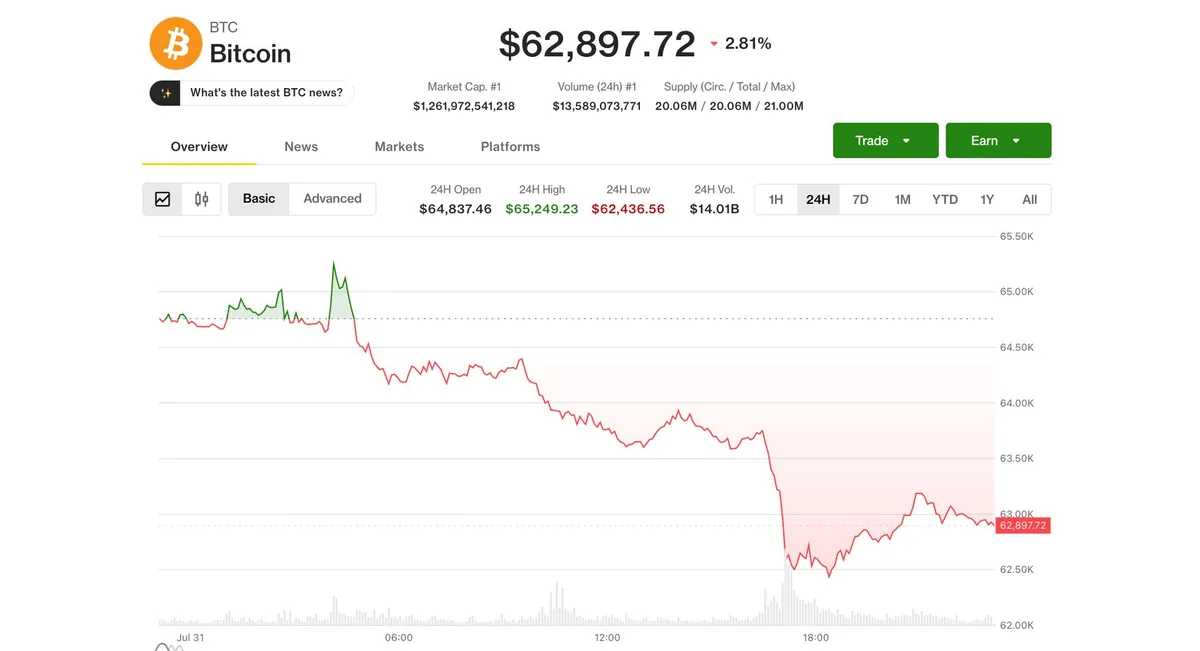
Bitcoin ended July with a monthly gain, though analysts expect August could be more volatile. They said the recent forced-selling pressure that weighed on the market appears to have already run its course.
Read
The latest State of Crypto update says the industry has two weeks left in the push for the Clarity effort. The development keeps attention on U.S. crypto policy as companies and market participants watch for regulatory direction.
Read